I built this project to predict NFL game outcomes using over 35 years of open-source data with 40+ attributes. The attributes were a mix of categorical and numerical features that required careful preprocessing. Models built include Random Forests, XGBoost, Neural Networks, Bayesian Networks, and regression models, each evaluated for suitability to this specific classification task.
The core data challenge: missing values were imputed using linear interpolation (e.g. for venue temperature) rather than dropping rows, preserving valuable historical signal. Categorical variables were one-hot encoded; the target (result: home win, away win, OT) was label encoded. Redundant columns like duplicate QB identifiers were dropped to reduce noise.
The prediction function takes real pre-game conditions like team matchup, game type, surface, weather forecast, and more, and outputs a score differential. Positive means home team wins, negative means away team wins. For the Super Bowl, PHI was treated as the home team based on the official scoreboard ordering (KC–PHI).
Results & model comparison
- Random Forest was the best overall model — peak 71% accuracy on win prediction, most robust in practice
- Neural Network achieved precision of 0.8 but lower recall; less reliable than RF in playoff conditions
- After updating with conference finals data, both models converged on Eagles to win the Super Bowl
- Naive Bayes and other models were intentionally included to demonstrate the cost of poor model selection
- Weather attributes (temp, wind), location, and game type all improved Random Forest performance meaningfully
checking API...
Predicted winner
—
This analysis focused on the 2025 NBA Finals series between Tyrese Haliburton and Shai Gilgeous-Alexander. Using game-by-game playoff logs, I built visualizations with rolling 3-game averages across key performance indicators to track how each player trended through the series.
The analysis was extended to include regular season data as a baseline, assessing whether either player showed signs of fatigue or performance drop-off that could signal injury risk heading into the Finals.
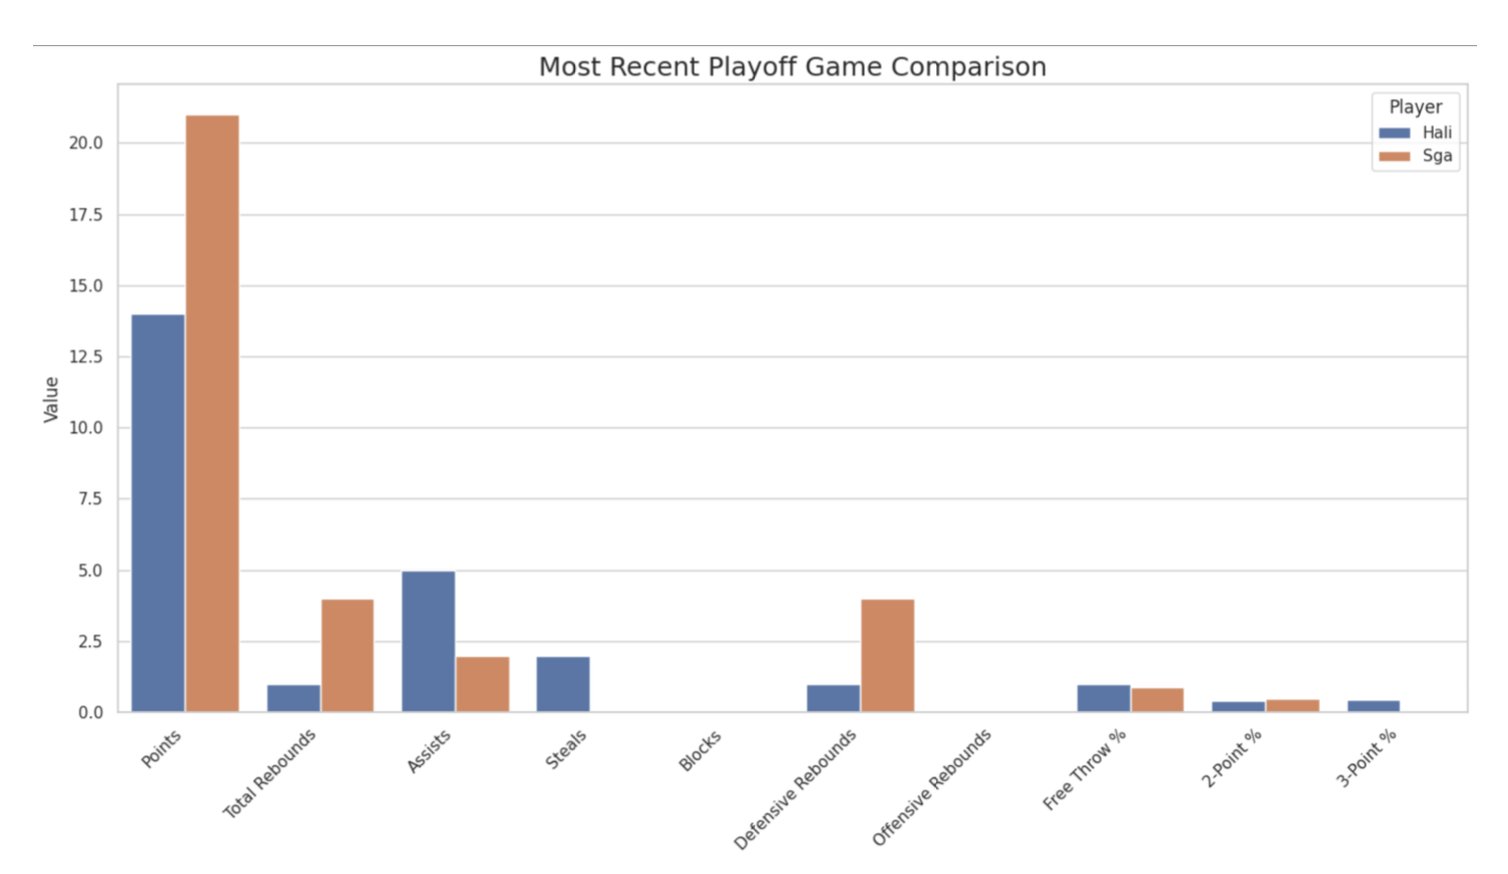
Most recent playoff game comparison across all key stats — SGA led in points, rebounds, and defensive metrics
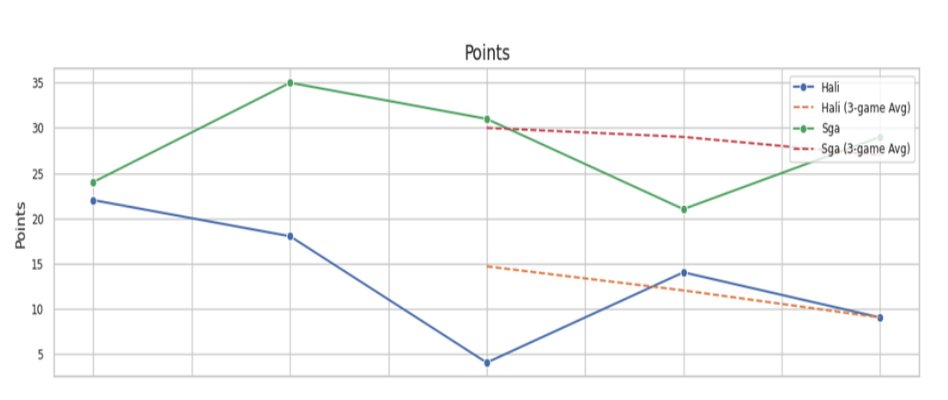
Points per game with 3-game rolling average — Haliburton's trend declined sharply through the series
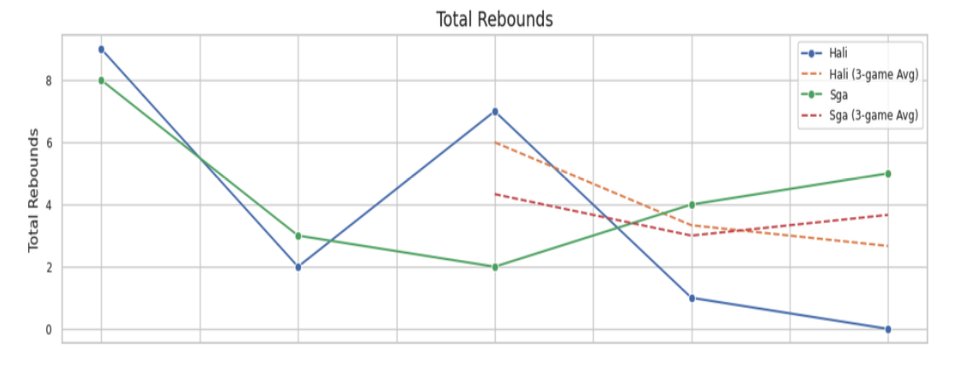
Total rebounds — SGA's rebounding trended upward as the series progressed
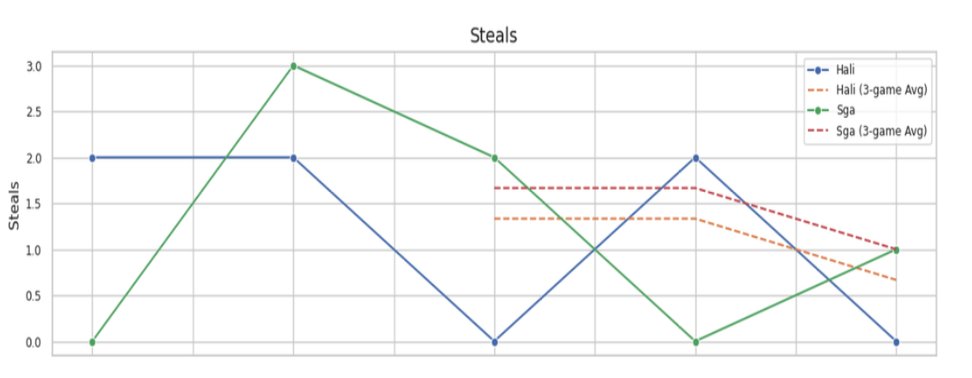
Steals — SGA peaked at 3 in game 2; both players declined toward the end of the series
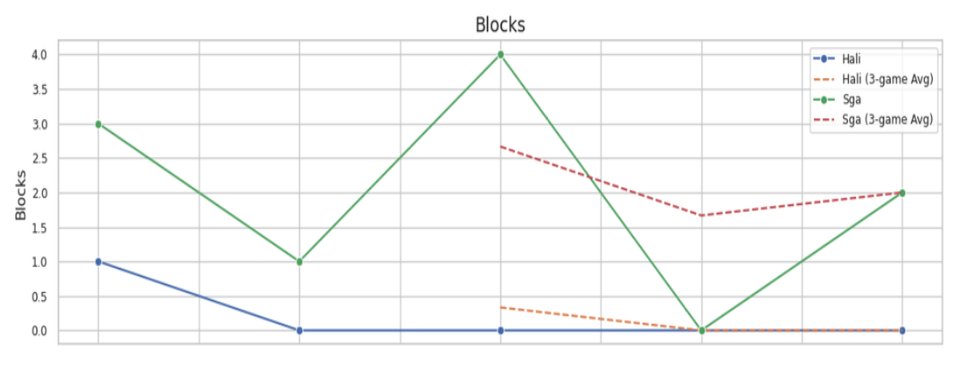
Blocks — SGA consistently contributed defensively; Haliburton near zero throughout
Key findings
- SGA outperformed Haliburton in points, rebounds, steals, and blocks across nearly all games in the series
- Haliburton's 3-game rolling average for points declined steadily — from ~20 early to under 10 by the end
- SGA's rolling average remained elevated throughout, suggesting no late-series fatigue
- Regular season vs playoff comparison revealed no significant injury-risk signal for either player
This project addressed the intersection of climate change, public transit decline, and urban planning in Mesa, AZ. All data was publicly available through the City of Mesa’s website, Valley Metro’s budget reports, and the Open-Meteo weather API.
Temperature forecasting: LSTM and ARIMA models were trained on 10+ years of historical data. The optimal LSTM used 2 layers, 100 units, Adam optimizer, trained for 20 epochs, achieving MSE and RMSE both under 0.38, meaning less than 0.4°C deviation from actuals. The 30-day forecast (shown below) projects continued seasonal decline consistent with winter 2025 trends.
Ridership analysis: Valley Metro data showed ridership collapsed from 283k riders in February 2020 to just 154k in April 2020 and never recovered to pre-pandemic levels. This was attributed to a combination of the pandemic, the shift to remote work, and persistently higher unemployment.
Geospatial work: Using QGIS 3.4, population estimates were joined to census tract shapefiles using the GEOID key to visualize density. Tracts with no service overlap were isolated. For example, the eastern region of Mesa was heavily underserved despite high population density (dark blocks in the map below).
Route design: 5 new bus routes were proposed covering underserved areas with 45 new stops, minimizing redundant coverage. A 500m walkability buffer confirmed over 63,000 residents would gain access within a 5-minute walk.
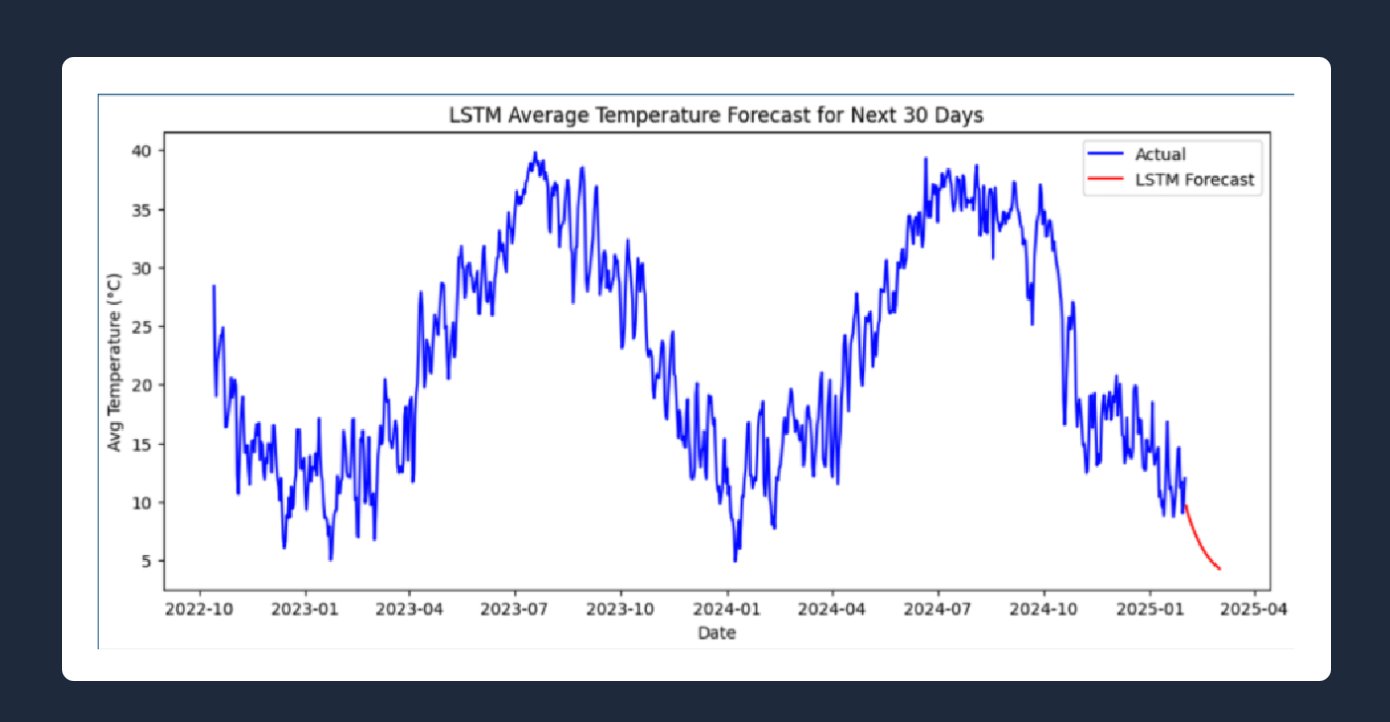
LSTM 30-day average temperature forecast — MSE < 0.38, trained on 10+ years of Open-Meteo data
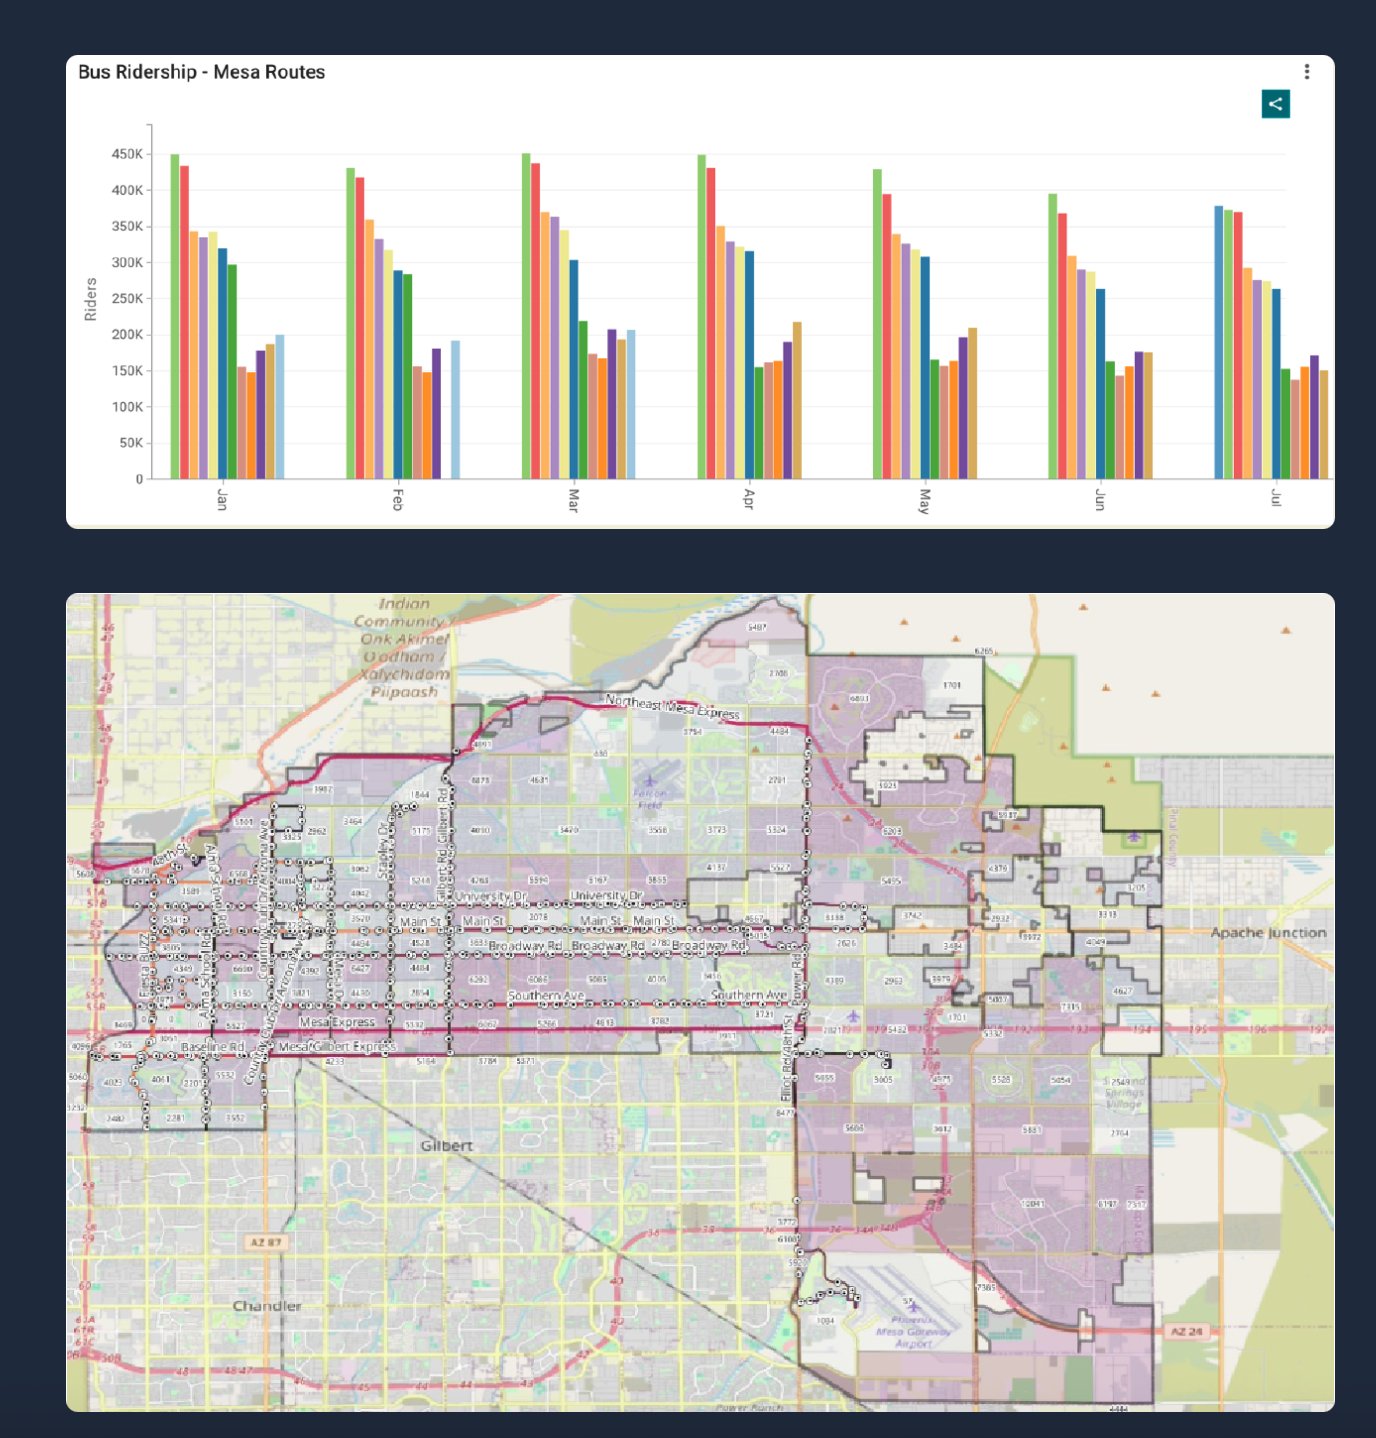
Left: monthly bus ridership per route showing post-pandemic decline. Right: QGIS service coverage map
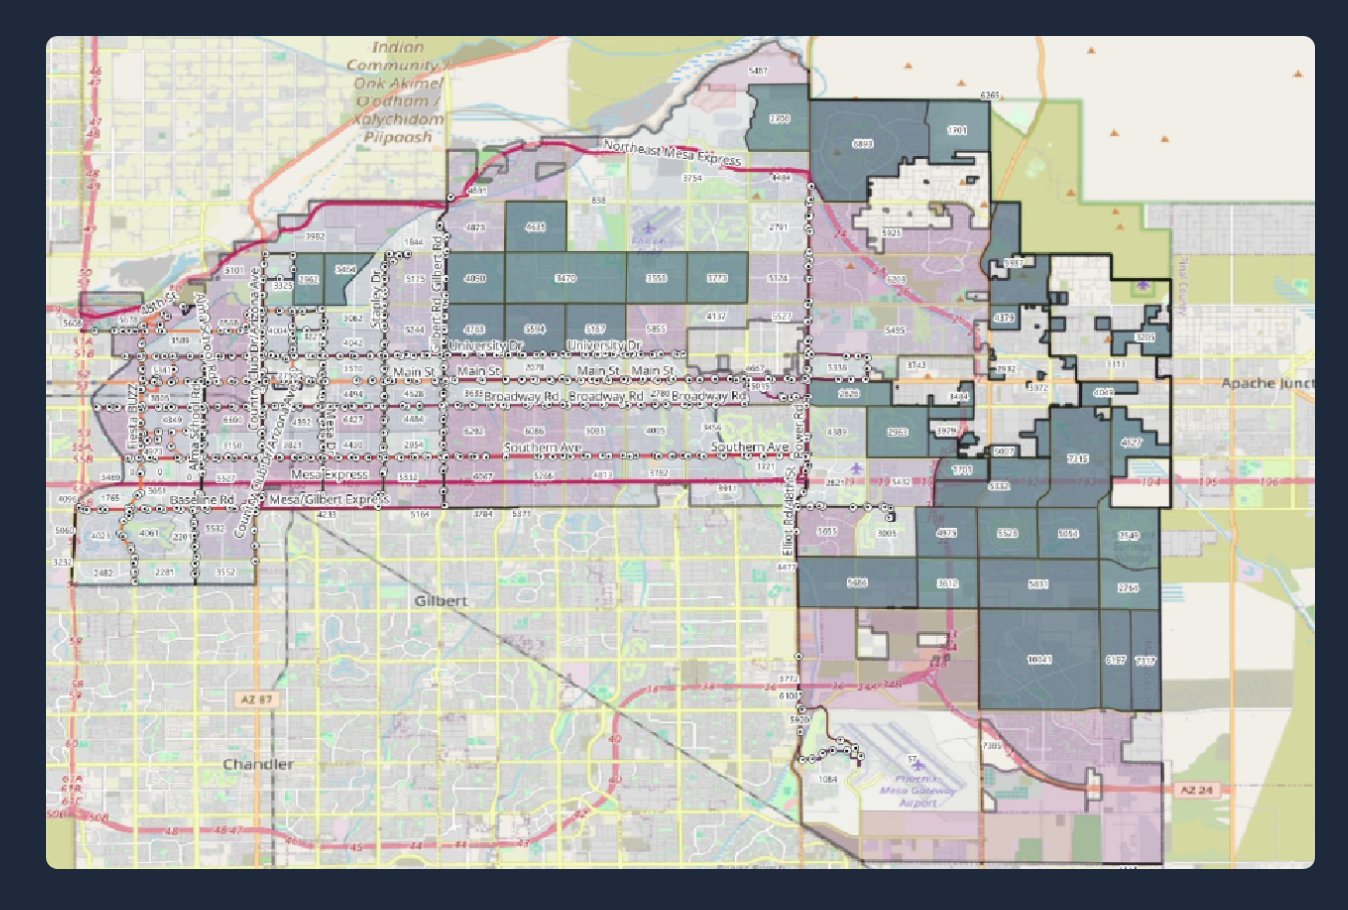
Underserved census tracts — dark blocks show population with no transit overlap
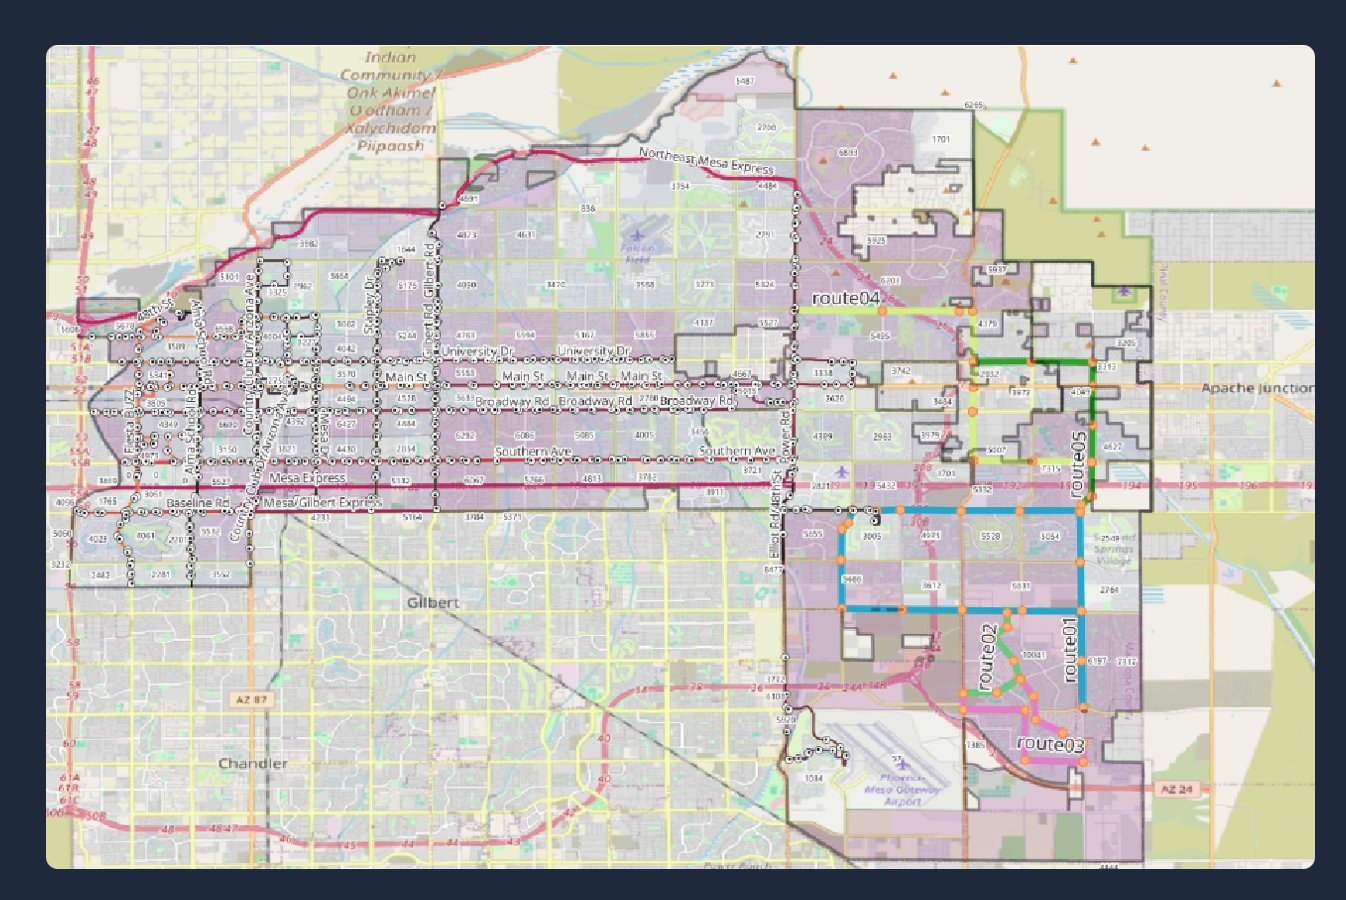
5 proposed new routes (colored lines) covering gaps in eastern Mesa
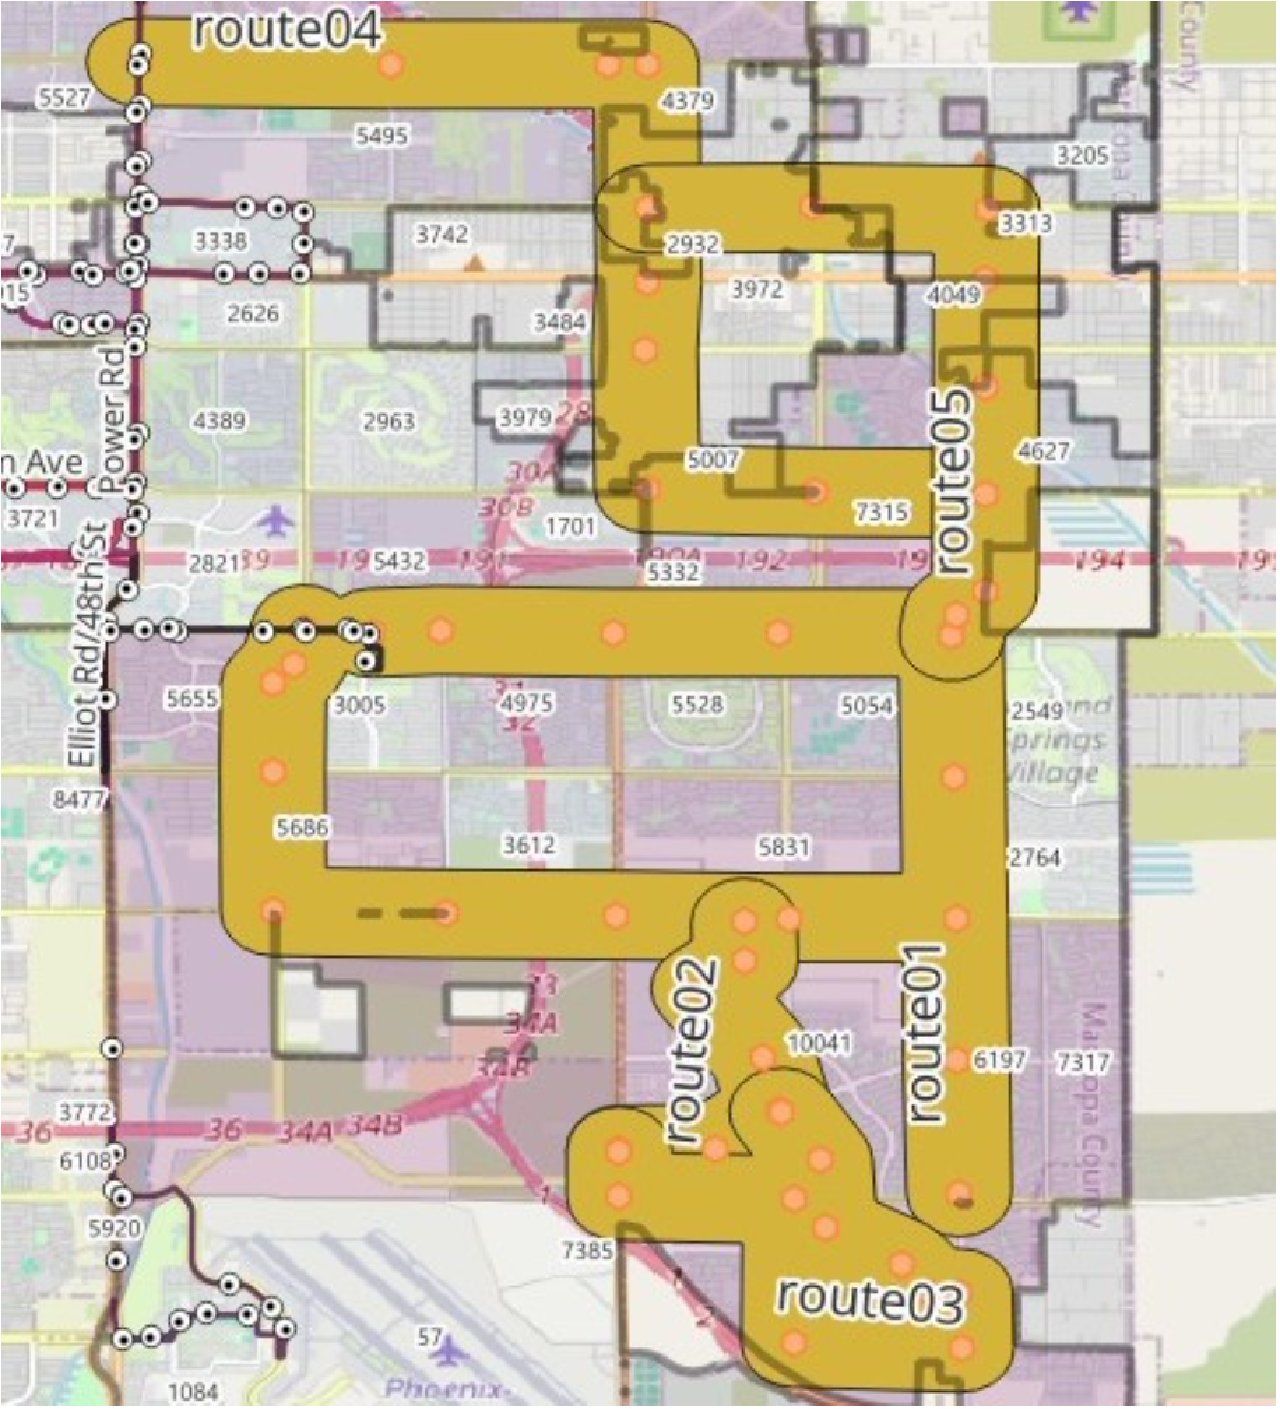
Zoomed view of proposed routes with 500m walkability buffers and bus stop vertices
Financial & environmental impact
- Mesa’s transit budget allocated only $2.7M of $158M to personnel, with many pass readers non-functional
- 45 new bus stops at $12k each totals $540k — less than 0.15% reallocation of the city’s foreign aid budget
- Assuming 15% adoption among affected residents: ~8,000 tonnes CO₂ saved per year (diesel buses)
- With electric buses: over 22,000 tonnes saved — equivalent to eliminating 20M miles of gas car travel or planting 400k trees
This project applied big data techniques to urban transit analysis — specifically using SparkSQL range joins to efficiently query millions of passenger records and identify spatial hotspots where demand was highest relative to supply.
The core challenge was performance: naive spatial joins on large datasets are prohibitively slow. Using Spark's distributed compute and optimized range join strategies, I brought query times down to a practical level while maintaining statistical rigor in the hotspot identification.
Key findings
- Identified statistically significant hotspots using Getis-Ord Gi* spatial statistics
- Range joins on datasets of millions of records completed in minutes on distributed compute
- Hotspot clusters showed strong correlation with employment centers and transit transfer points